Getting expert knowledge from domain specialists is an expensive and lengthy process. In this post, we explore how to generate domain-specific rules from the data using statistical quantiles with logic programming. This framework, which we call Statistical Quantile Rules (SQR), is capable of generating hundreds of thousands of rules that are consistent with the underlying data without a domain specialist.
Models make mistakes that stem from a variety of causes: noisy data, distribution shift, adversarial manipulation, and so on.
Accuracy, the most common metric, aggregates all these errors into a single number.
However, not all mistakes are created equal.
While some errors may be close to correct, other errors can be nonsensical and are inconsistent with even basic rules that govern the data.
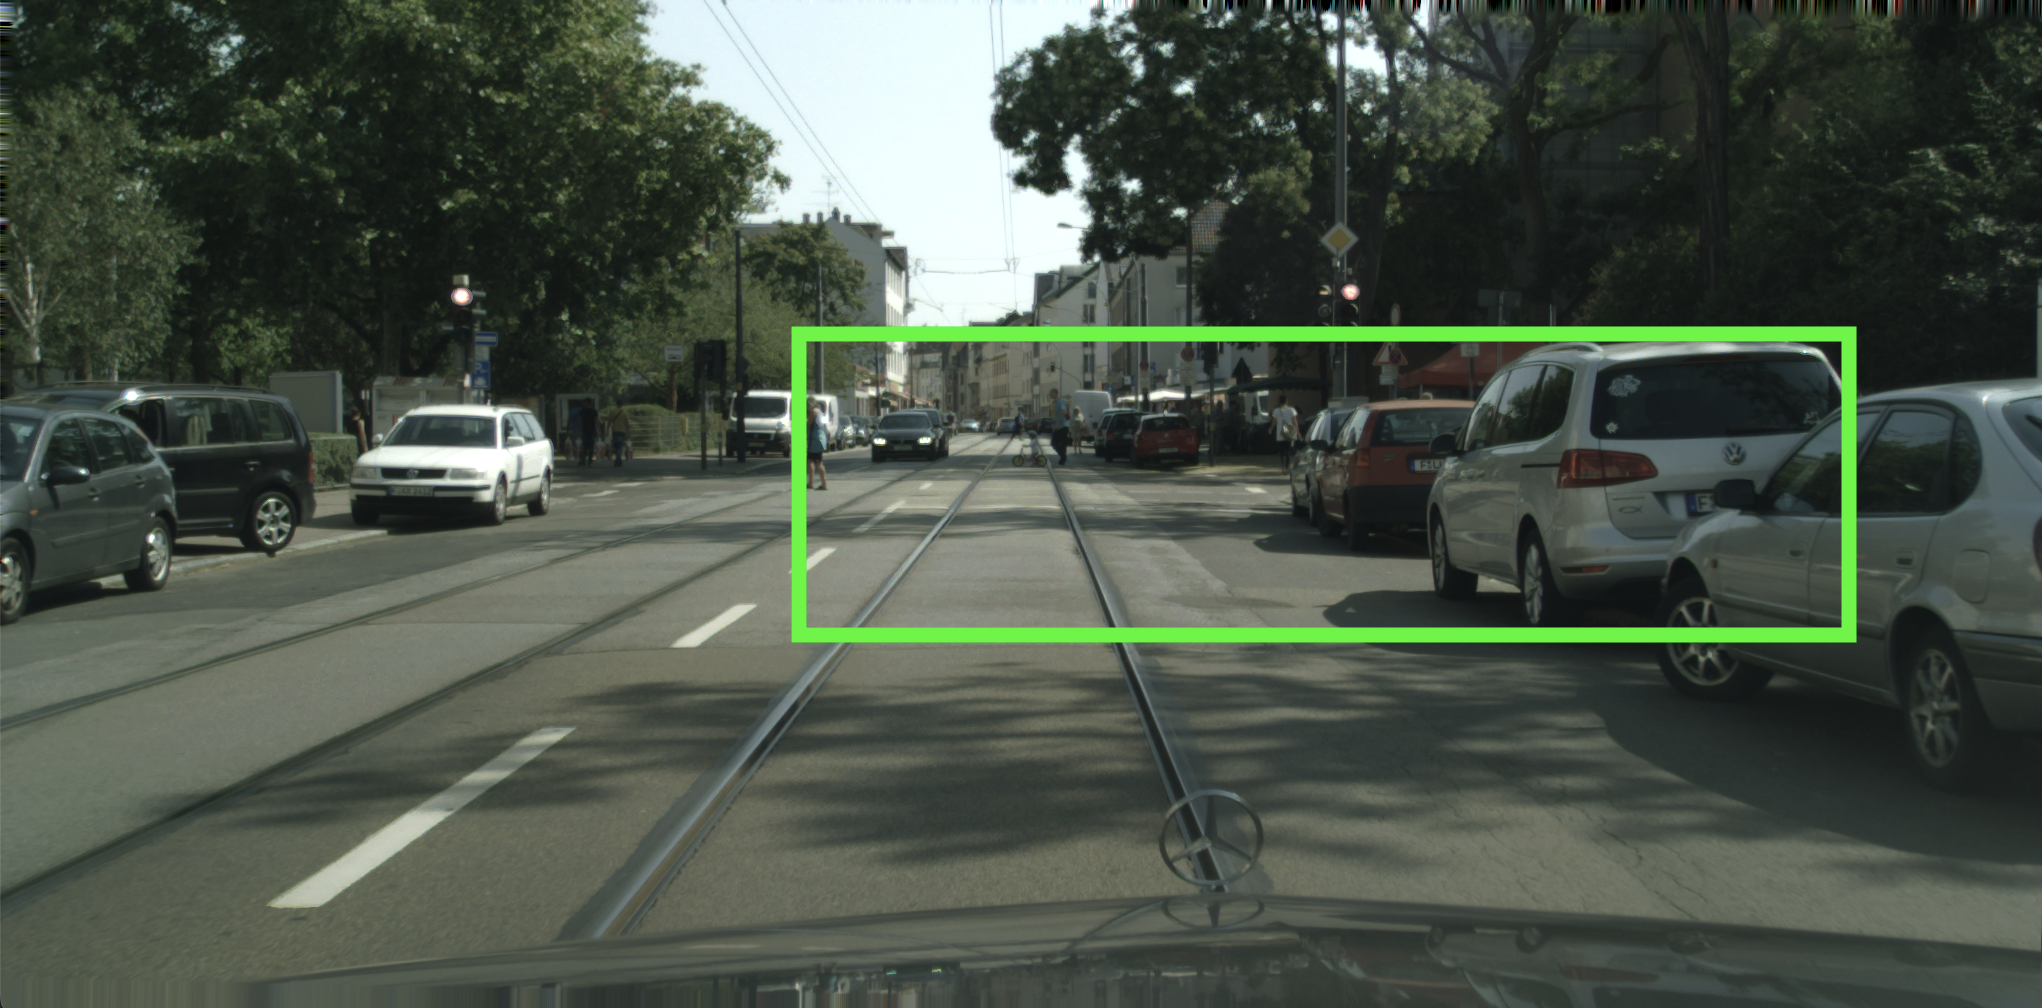
For instance, here is a figure that shows such a nonsensical error.
A prediction of a car by the EfficientPS Model. This prediction is totally unrealistic as no real car has such a long proportion.
The green bounding box is a prediction made by the EfficientPS model, a top model for detecting objects on the self-driving CityScapes dataset.
The bounding box is as wide as the street and is predicted to be a car. However, there does not exist a reasonable car that comes close to this width for its height!
Even worse, this kind of error can cause the vehicle’s controller to abruptly halt to avoid the perceived danger, potentially causing harmful consequences.
These kinds of errors contradict rules based on human intuition, such as our understanding about the typical width of a car with respect to its height.
In this work, we seek to generate rules that capture nonsensical errors from the data without having to rely on a domain expert. We can then use these rules to find violations as well as improve model predictions to respect these rules.
Statistical Quantile Rules (SQRs)
One way to find such rules is to manually craft them. This is the typical approach when creating domain-specific rules, but doing so is challenging and costly, especially at scale.
An alternative approach, which we take in this work, is to appeal to the underlying data to automatically extract and generate rules.
But what makes a good rule? We can’t just generate any rule, or they might end up being nonsensical as well. A good rule should satisfy the following desiderata:
Validity: They must hold true over most of the data they are generated over while allowing for some exceptions due to potentially noisy data,
Expressivity: They must be expressive enough to capture complex phenomena and relationships over the data, and
Scalability: They must be generatable at scale without the requirement of substantial human supervision.
Given these three requirements, we propose to specify such rules as Statistical Quantile Rules (SQRs).
An SQR is exactly what it sounds like: a rule based on the quantile statistic, which is estimated from the data.
Definition (Statistical Quantile Rule): Let $X$ be a random variable and $\phi(X)$ be some statistic of $X$.
Then, if
$$
P(a \leq \phi(X) \leq b) = 1 - \delta
$$
for some $\delta\in \mathbb R$ and interval $(a,b)\in \mathbb R^2$, then the rule $a \leq \phi(X) \leq b$ is a $1 - \delta$ quantile rule.
Intuitively, this states that the interval rule $a \leq \phi(X) \leq b$ is valid for $1 - \delta$ of all the data, and thus satisfies the validity requirement when the quantile $\delta$ is sufficiently small.
After picking a desired quantile $\delta$, the values of $a$ and $b$ are estimated from the data as the upper and lower $1 - \delta$ quantile bounds.
Coming back to our example, if we consider
$\phi$ to be the aspect ratio of cars (height divided by width)
$\delta$ to be 0.02 (to have 1% in each tail of the interval)
We can estimate the interval $(a,b)$ in the SQR by calculating the aspect ratios of all the cars in the dataset, and taking the 1- and 99-percentile.
This results in the rule
\[0.07 \leq \mathtt{ratio}(X) \leq 2.77\]
While this rule is satisfied by 98% of all the ground truth bounding boxes of cars, it is not satisfied by the prediction from our example.
We can therefore use such rules to identify predictions that violate them.
Such rules can also be made more expressive by using more complex statistics, or by even combining statistics.
For instance, one can combine statistics like the widths and aspect ratios of the bounding boxes of cars to produce rules such as the follows:
This, along with the fact that all the values are generated given a dataset and a value of $\delta$, also allows for generating several such rules at scale from a small set of statistics.
Generating SQRs
Now that we have defined SQRs, we can now try to generate them at scale.
To do so, we propose the Statistical Quantile Rule Learning (SQRL) framework.
SQRL is a framework that integrates logic-based methods with statistical inference to derive these rules from a model’s training data without supervision.
It also allows adapting models to these rules at test time to reduce rule violations and produce more coherent predictions.
Let’s go through how SQRL works step by step, using the EfficientPS model trained on the KITTI dataset as an example. Before we can start creating SQRs, we need to figure out the relevant statistics.
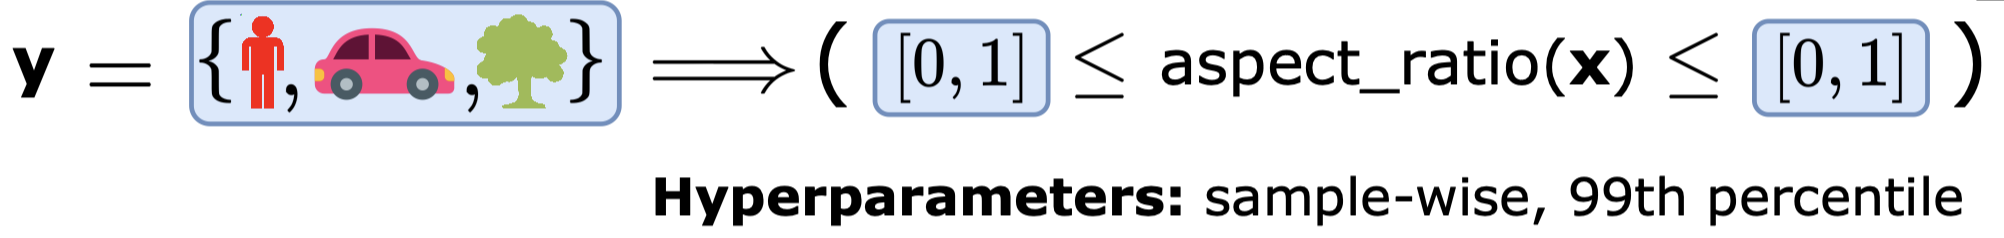
We use something called a rule schema to outline the rules we want to create.
The Schema of the SQRL Framework.
This schema, shown in the figure, details the shape of the rule, the statistics to base it on, the labels to use in the generation process, and other factors. For example, we could use a rule schema to create SQRs for the aspect ratios of cars, people, trees, and so on.
For instance, we can specify a rule schema to generate SQRs over the aspect ratios of cars, people, trees, etc.
Once the rule schema is specified, we can generate the SQRs.
This is a two-step process.
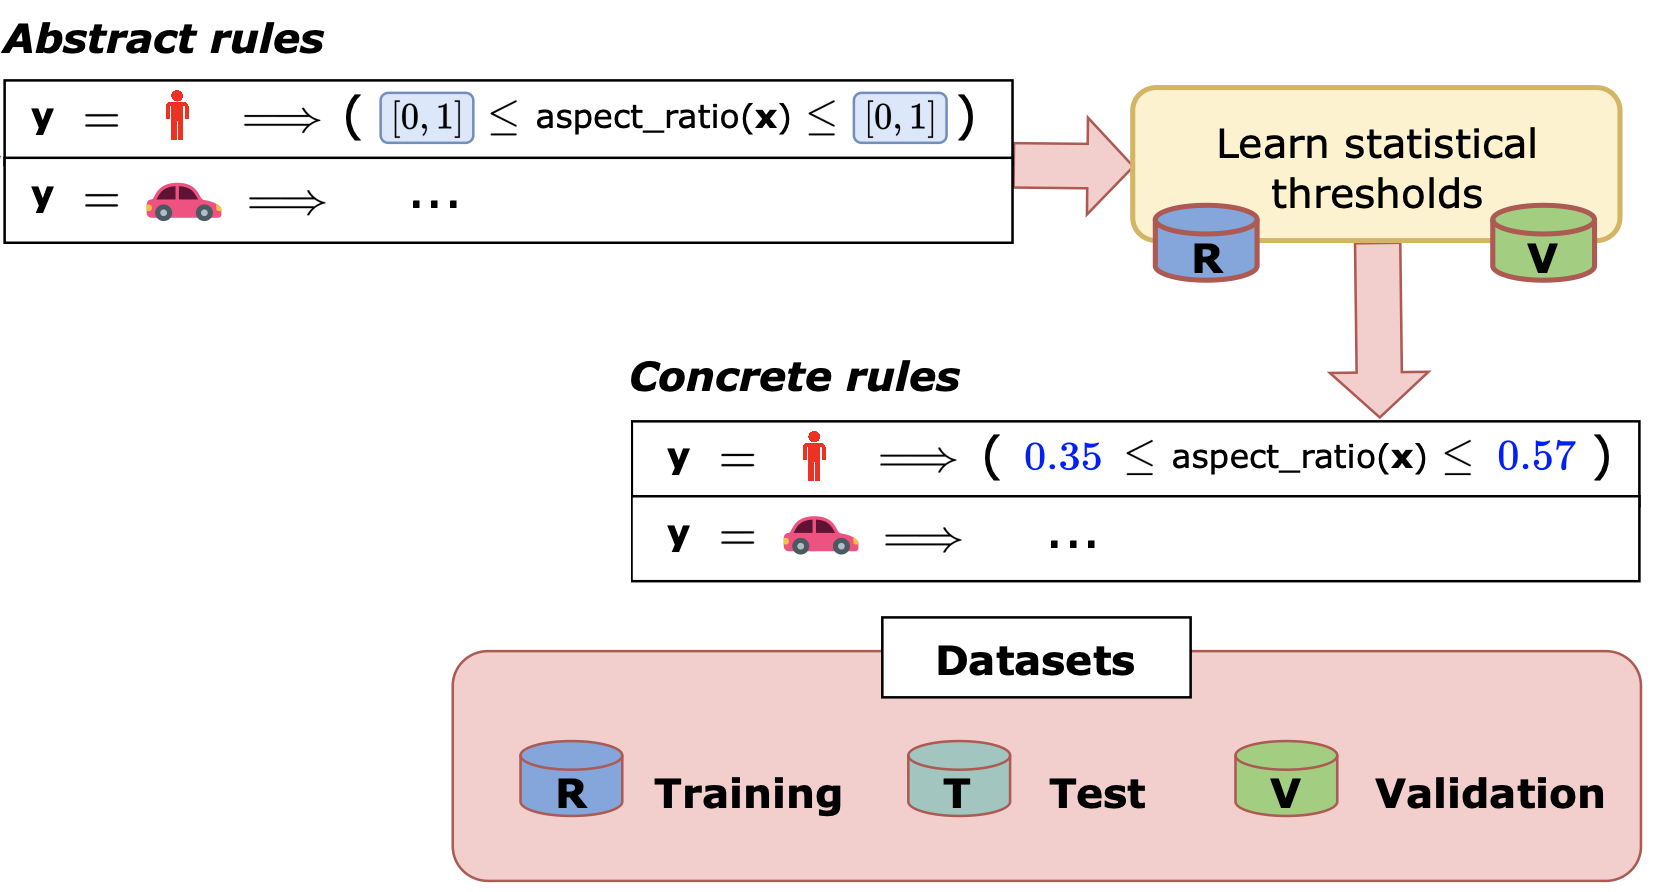
First, we generate abstract rules that fit the shape outlined in the rule schema, as so:
The Abstract Rules of the SQRL Framework.
Note that none of the abstract rules contain any of the statistically inferred bounds associated with the rules.
We then statistically generate the bounds for these abstract rules to produce a suite of concrete rules that make up our final set of SQRs:
The Concrete Rules of the SQRL Framework.
One can also optionally validate these rules using a held out validation set to consider only the most valid rules.
Using SQRs
While there are several potential applications for SQRs, we focus on two of them in this work.
We first evaluate models use the suite of generated SQRs, and then improve them by adapting them to the SQRs at test time.
We study this over five applications and domains in our paper, but we will focus on three of them here.
Object Detection:
We first consider the Object Detection task used earlier in this post.
Here, we study the EfficientPS model trained over the KITTI dataset.
We use SQRL to generate 252 SQRs using 6 statistics to evaluate this model over several datasets and test its ability to adapt to different distributions.
An example of a generated SQR is as follows:
$$
(ratio(X) < 0.81 \land 20.22 \leq width(X) < 1655.17) \land
$$
$$
(0.81 \leq ratio(X) < 1.16 \land 14.4 \leq width(X) < 614.24) \land \ldots
$$
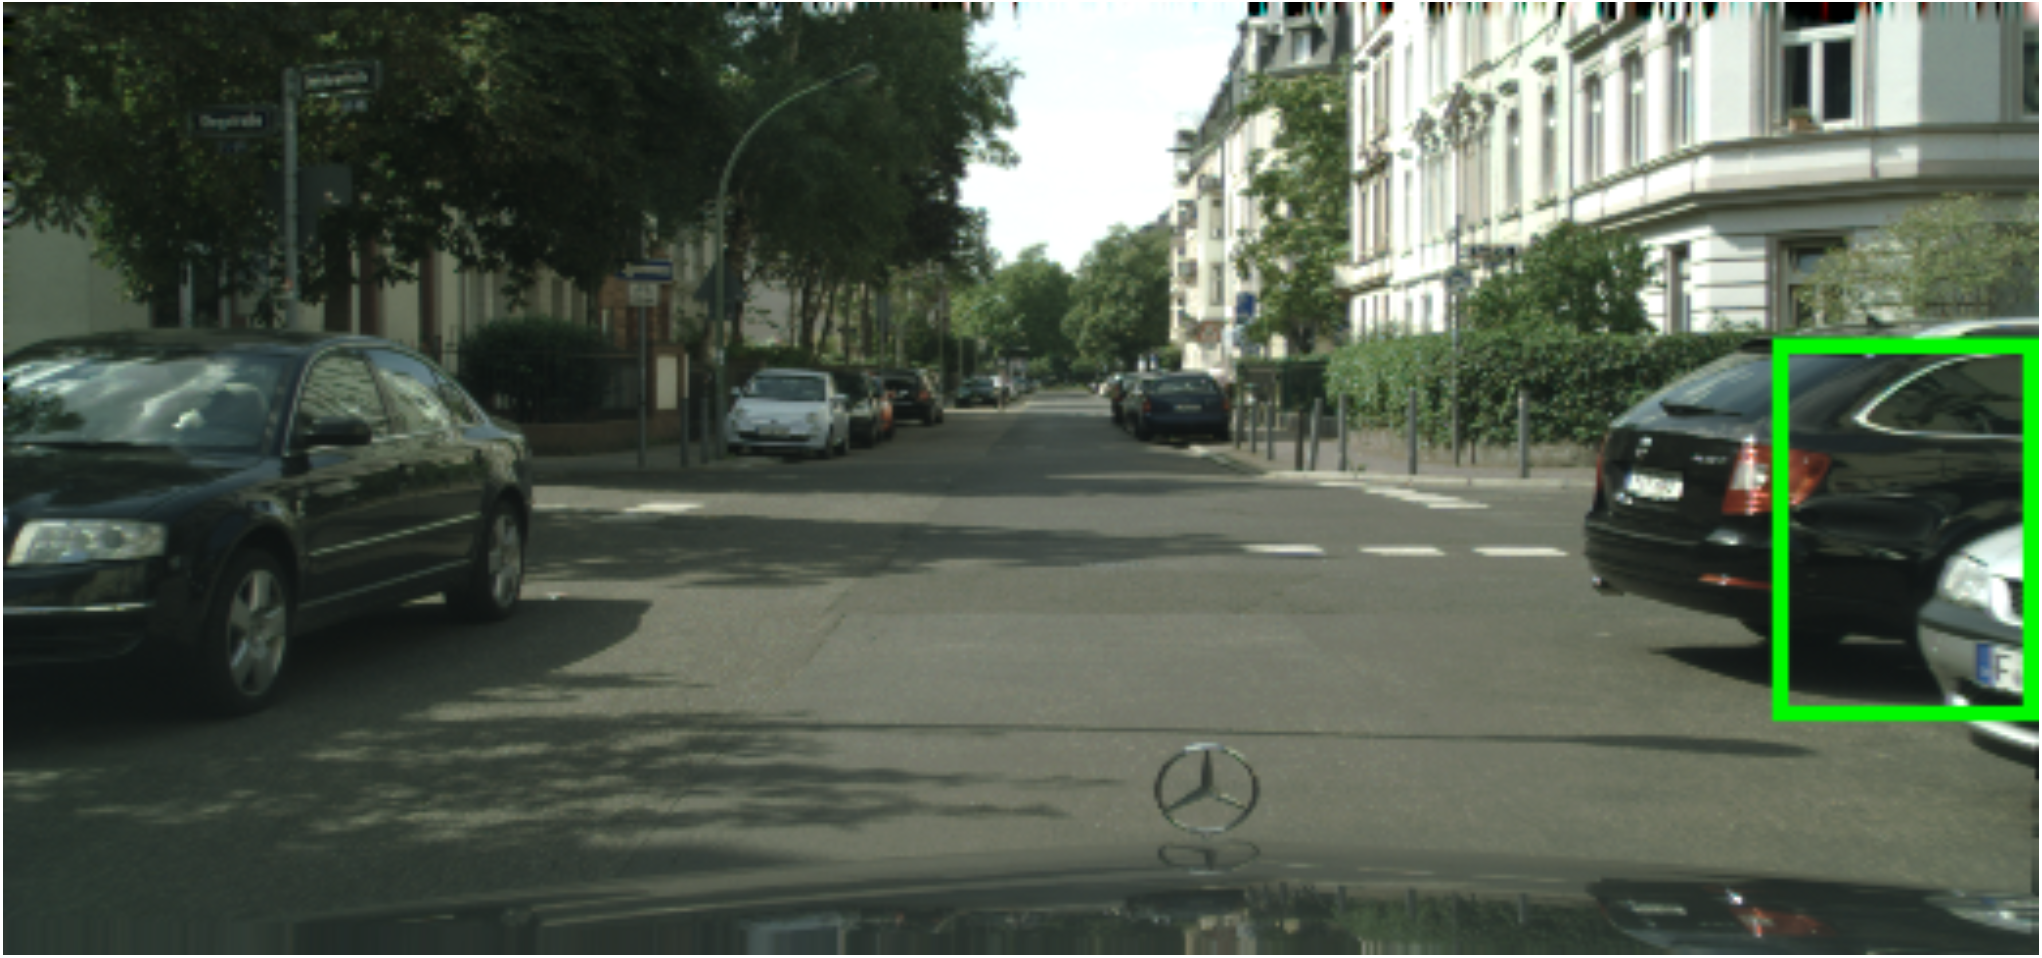
Adapting the model at test time to the above rule helps improve the quality of predictions of the model, as we show here:
A prediction of a car by the EfficientPS Model (left) originally and (right) after adapting it to the rule at test-time.
Over all, we find around 8000 total violations of the 252 generated SQRs in a rainy version of the CityScapes dataset, which can reduce by around 30% after adapting the model at test time to these SQRs.
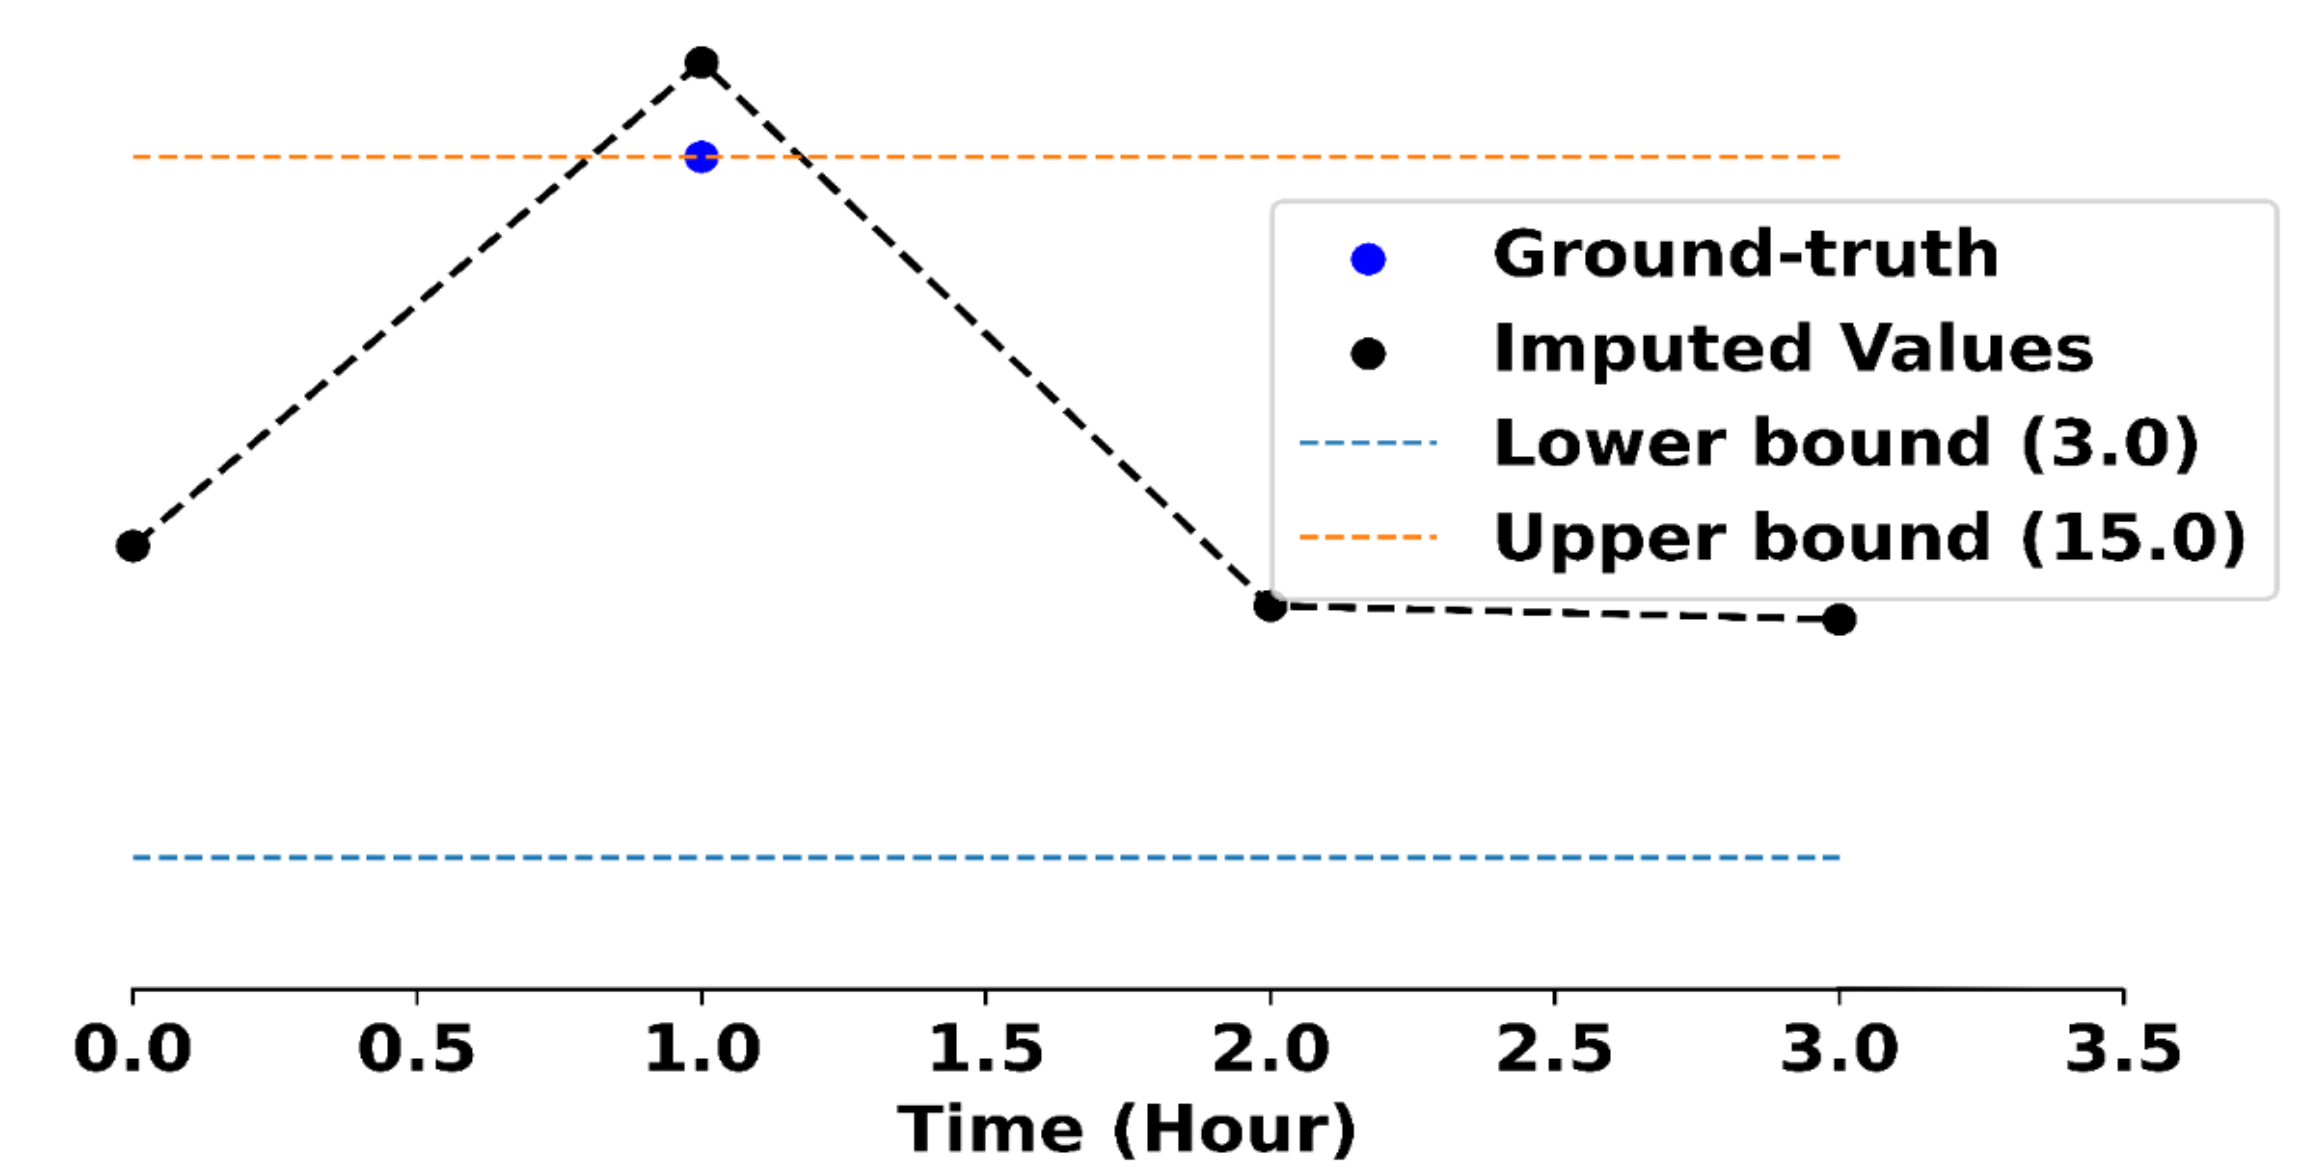
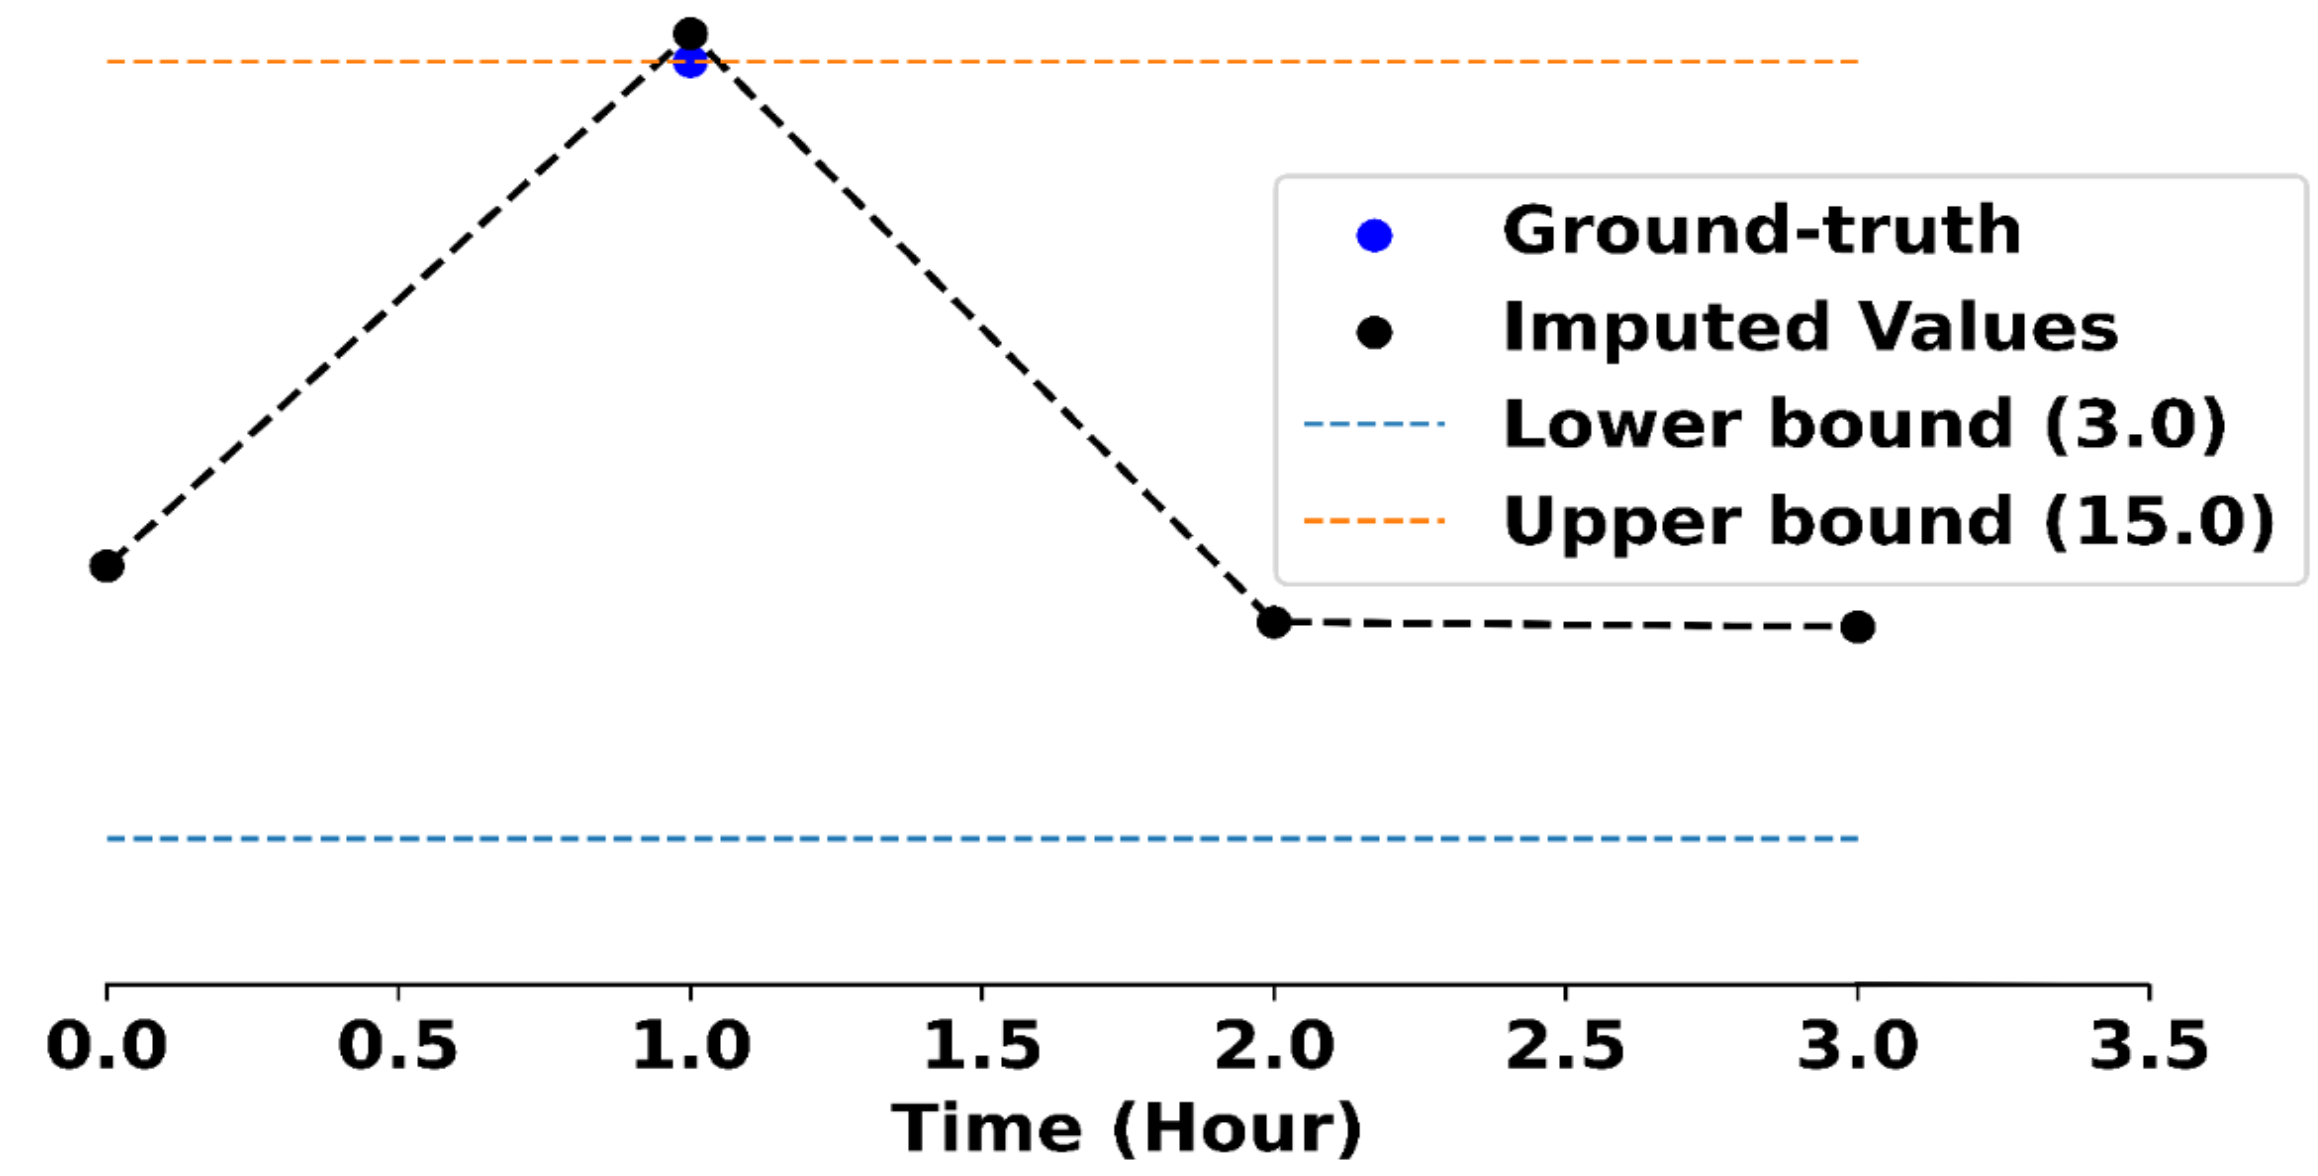
Time Series Data Imputation
In this task, we train the SAITS model over the PhysioNet Challenge 2012 dataset to impute missing values within time-series data.
Here, we choose to generate only 35 SQRs, one for each of the 35 features in the dataset that need to be imputed.
One such SQR generated over the Glasgow Coma Score is as follows:
$$
(3 \leq GCS(X) < 15)
$$
Adapting the model at test time to this rule results in the imputed value being closer to the ground truth value, as shown in the figure below.
A datapoint imputed by the SAITS model. (left) originally and (right) after adapting it to the rule at test-time
Over all, we find around 197 violations per sample (or more than 150K total violations), which are reduced by around 68% after adapting the model at test time to these SQRs. Moreover, the performance of the model improves by around 32% after adapting it to these SQRs.
Sentiment Analysis
In this task, we evaluate the FinBERT model trained over the Financial PhraseBank dataset for sentiment analysis.
In order to generate SQRs for this task, we first extract 26 features using emotion classification and topic classification models.
This allows us to generate a total of 7878 SQRs over the dataset, of which we use 158 by validating it with a held out validation set.
One such SQR is as follows:
$$
\text{neutral}(x) \leftarrow 0.0204 \leq \text{fitness}(x) < 0.0234 \land
$$
$$
0.0387 \leq \text{news}(x) < 0.1408
$$
as in, if the likelihood that the sentence is about fitness is between 0.0204 and 0.0234, and that it is about news is between 0.0387 and 0.1408, then the sentence is neutral.
This rule is violated when FinBert predicts the sentiment for the following sentence to be positive:
Anttila's online department store - NetAnttila - has an established position as the best-known, most visited, and most shopped online store in Finland.
The rule is violated because according to the feature extraction models, the likelihood that the sentence is about fitness is 0.021, and that it is about news is 0.141, which is outside the bounds specified by the rule.
However, adapting FinBert to this rule results in the prediction being changed to neutral, which is the correct sentiment for this sentence.
Overall, we find a total of only 578 violations (around 0.6 violations per sample) for this task, though after adapting the model at test time to these SQRs, we find that the violations reduce by around 16%.
Conclusion
In conclusion, we formalized statistical quantile rules as a means of characterizing basic errors inconsistent with training data and defined the problem of extracting such rules at scale.
We also proposed the SQRL framework to generate such rules and showed how to use them to evaluate and improve models.
For more details, please refer to our paper here.
Citation
@article{naik2023machine,
title={Do Machine Learning Models Learn Statistical Rules Inferred from Data?},
author={Naik, Aaditya and Wu, Yinjun and Naik, Mayur and Wong, Eric},
year={2023}
}